Learn how to transform raw git logs into readable engineering reports. Explore tools for founders and PMs to track progress without reading code.
Read ← Blog
Guide · · 12 min read
Engineering Metrics: How to Measure Velocity Without Friction
Learn how to use engineering metrics like DORA and SPACE to track software delivery while maintaining developer experience and data privacy.
DevSummary Team
Address the disconnect between technical data and business expectations when lead times spike or velocity flatlines. When a non-technical founder asks why features promised for the October 2026 release remain “In Progress,” use context to explain the technical debt and cross-team dependencies that raw charts often obscure.
Use this guide to build a hierarchy of engineering metrics that prioritizes technical health and team output over simple commit counts. Implement the DORA and SPACE models to track delivery performance alongside the human aspects of development. By the end of this piece, you will be able to select a reporting structure, such as the DX Core 4 or the DRIVE framework, to generate actionable insights instead of vanity data.
Translate Git activity into clear narratives for stakeholders by using local-first tools. This method allows you to justify engineering efforts to partners and protect developer well-being while maintaining source code privacy.
Key takeaways
- Prioritize flow-based metrics over individual output to avoid incentivizing the wrong developer behaviors.
- Balance technical delivery speed with the SPACE framework to ensure long-term team health and retention.
- Use automated reporting tools to bridge the gap between raw Git logs and stakeholder-ready narratives.
- Implement local-first reporting for sensitive codebases to maintain security while gaining performance insights.
Engineering metrics quantify the health and output of software teams
Engineering metrics are quantitative data points harvested from development workflows to assess efficiency, output quality, and team well-being. These measurements provide a structural view of how code moves from a developer’s machine to production. While specific indicators vary by organization, 7 engineering metrics that matter typically fall within six key categories or can be grouped into two main categories to simplify reporting. By tracking these data points, leaders can identify bottlenecks in the software delivery life cycle (SDLC) without relying on anecdotal evidence.
The mechanism for gathering these metrics involves aggregating raw data directly from version control systems and CI/CD pipelines. This automated extraction captures timestamps for commits, pull request approvals, and deployment successes. To ensure these data points translate into actionable improvements, leaders should integrate them into broader software development team management: 8 best practices. This approach shifts the focus from manual status updates to a real-time, objective understanding of how technical debt or workflow friction impacts the team’s ability to ship features.
Metrics fail when they are weaponized as punitive tools rather than used for diagnosis. Using velocity or cycle time to rank individual developers creates a culture of fear that encourages gaming the system, such as breaking tasks into artificially small units to inflate commit counts. For metrics to remain effective, they must function as a compass for process improvement. When treated as diagnostic signals, these data points highlight where the system is failing the team, allowing managers to clear blockers and optimize the environment for high-quality output.
The DORA model defines the standard for delivery performance
Use the DORA framework to set a numerical starting point for software delivery. According to the pocket guide to engineering metrics published on July 31, 2026, the model tracks five indicators: Deployment Frequency, Change Lead Time, Change Fail Rate (CFR), Failed Deployment Recovery Time, and Deployment Rework Rate. These metrics group performance into tiers. Use them to compare your speed and stability against common benchmarks.
Adopt these metrics to create a shared language for DevOps maturity across different teams. Measure how often code reaches production and how efficiently the system recovers from failure to find major points of congestion in the deployment pipeline. This data ensures you treat engineering velocity as a result of stable, repeatable processes rather than a simple volume of work. It moves the focus away from how busy staff appear and toward the actual flow of value.
Treat these indicators as an essential status report, but remember they are lagging indicators. They describe outcomes rather than the specific actions that created them. Before you apply these benchmarks, read what are DORA metrics, and what they can’t tell you to understand the limits of the data. For example, a high Change Fail Rate shows a problem in the release process. It does not explain if the underlying reason is a lack of automated testing, poor peer review, or unstable staging environments.
Do not rely solely on the DORA model, as it creates a lack of insight into work in progress. These metrics track code movement through the delivery pipeline, but they do not explain why delays happen during a sprint. If a task stays blocked for several days, DORA eventually shows the delay in the Change Lead Time. It provides no context regarding developer burnout, excessive context switching, or mismanaged dependencies. To improve the entire engineering lifecycle, monitor internal team dynamics alongside delivery outcomes.
The SPACE framework captures the human element of engineering
Use the SPACE framework to track the cognitive load on engineers, which standard delivery metrics often ignore. While DORA metrics establish a baseline for speed and stability, they do not account for the mental friction that causes burnout. Shift your focus from mechanical outputs to the environment where work happens. By measuring satisfaction and well-being alongside technical performance, you can determine if high velocity stems from efficient processes or unsustainable pressure.
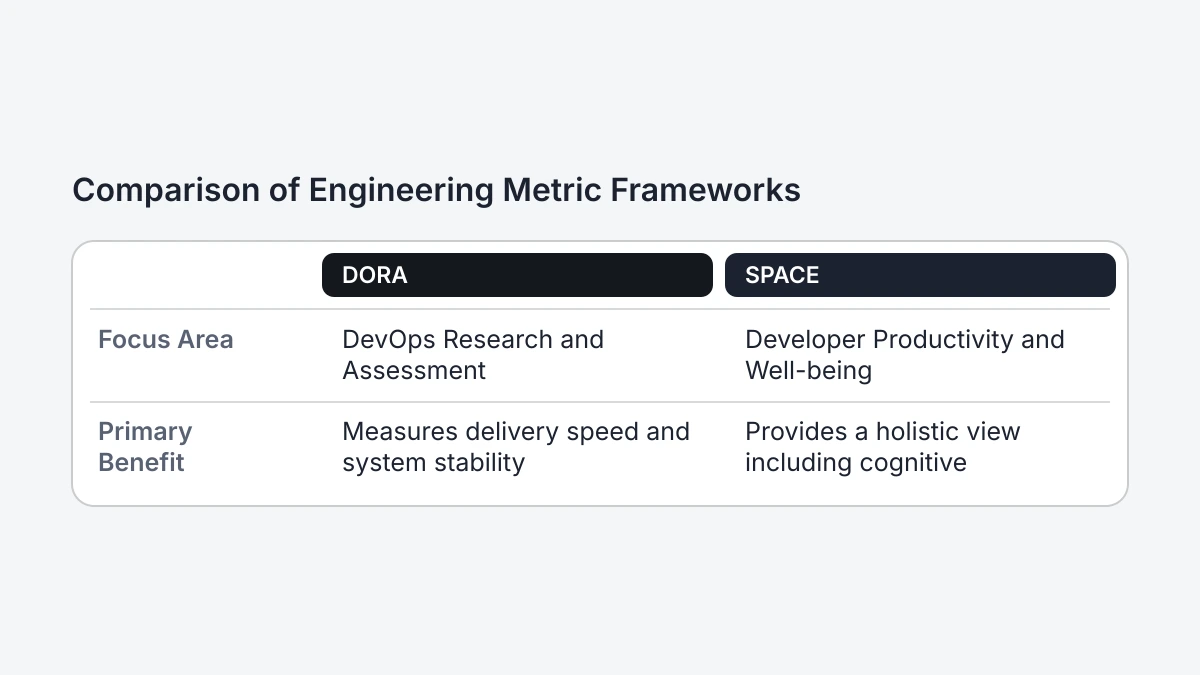
Implement this model by evaluating five distinct aspects of developer productivity to form a complete picture of how the engineering organization functions. These dimensions, which include satisfaction and well-being, performance, activity, communication and collaboration, and efficiency and flow, ensure that metrics do not incentivize harmful behaviors. For example, a narrow focus on activity might encourage “busy work,” but the SPACE framework prioritizes communication and flow. This approach treats software development as a collaborative, creative process where the quality of interaction is as important as commit frequency.
Since the publication of 7 Engineering Metrics That Matter in mid-2024, the industry has prioritized balancing delivery with developer experience. Managers apply these human-centric metrics to stop friction before it reduces deployment frequency or increases turnover. For technical implementation details, the DevSummary engineering blog offers guides on integrating these frameworks into current workflows. Using these qualitative signals allows leaders to protect the mental capacity of their teams while maintaining a competitive shipping cadence.
| Metric Category | Focus Area | Primary Benefit |
|---|---|---|
| DORA | DevOps Research and Assessment | Measures delivery speed and system stability. |
| SPACE | Developer Productivity and Well-being | Provides a holistic view including cognitive load. |
| DRIVE | Engineering Efficiency | Focuses on organizational alignment and business value. |
| DX Core 4 | Developer Experience | Identifies specific friction points in the dev lifecycle. |
DX Core 4 metrics correlate directly with employee engagement
The DX Core 4 framework prioritizes the developer’s journey by pinpointing exactly where friction occurs within the software development lifecycle. By focusing on qualitative and quantitative signals, organizations move beyond surface-level velocity metrics to address the root causes of developer frustration. Currently, over 300 companies across several industries including retail, pharmaceuticals, finance, and technology have integrated these specific engineering metrics into their management workflows. This widespread adoption across diverse sectors demonstrates that the framework is an effective and scalable tool for any large-scale enterprise looking to optimize its technical output while maintaining a stable environment.
Implementing these metrics yields measurable gains in both output and workforce stability. Organizations using the DX Core 4 framework have achieved up to a 12% increase in engineering efficiency, allowing teams to deliver features and fixes more consistently without increasing headcount. Furthermore, these same companies have realized a 15% improvement in employee engagement. High engagement scores are critical for long-term retention, as developers who feel supported by their tools and processes are less likely to experience burnout. By measuring specific friction points, leaders create a virtuous cycle where improved developer experience directly fuels organizational efficiency.
To drive tangible improvements, engineering leaders should use these metrics to identify and eliminate “toil,” which consists of the repetitive, manual tasks that provide no long-term value. The DX Core 4 framework provides the empirical data necessary to justify investments in internal tooling or infrastructure upgrades that might otherwise be sidelined by immediate product demands. When management uses this data to advocate for the developer’s daily experience, it builds trust and removes obstacles from the path between local development and production. This data-driven approach ensures that efficiency gains are sustainable and that the engineering culture remains resilient as the organization scales.
The DRIVE framework organizes metrics into five strategic pillars
Organize your engineering KPIs into the DRIVE framework to move beyond surface-level data like commit counts. As detailed in The 2026 Pocket Guide to Engineering Metrics, this framework uses five pillars: Delivery, Reliability, Initiatives, Vigilance, and Efficiency. Use this structure to balance speed against stability and avoid vanity metrics. By categorizing data this way, you can pinpoint specific bottlenecks instead of guessing why performance has dipped.
Start with Delivery and Reliability to measure output while maintaining quality. Track Delivery metrics to see how value flows to users through lead times and deployment frequency. Use Reliability to ensure that speed does not degrade system uptime or user experience. Analyze these pillars together to turn raw numbers into specific actions. For example, if you see high delivery rates but low reliability, your process likely prioritizes speed over testing and requires better automated safeguards.
The remaining pillars, which are Initiatives, Vigilance, and Efficiency, provide the context you need for long-term planning and resource management. Use Initiatives to align engineering work with business goals, Vigilance to monitor security and compliance, and Efficiency to assess the resource cost of your output. According to research published in July 2026, adopting this five-pillar approach allows organizations to see how every part of their engineering ecosystem interacts. This methodology ensures every tracked metric serves a strategic purpose, so you can optimize workflows without adding administrative overhead.
Translate raw Git activity into readable narratives for stakeholders
Engineering leaders often fall into the trap of presenting raw throughput data to non-technical stakeholders under the guise of transparency. While a technical lead sees a spike in commit frequency or a reduction in cycle time as a sign of high productivity, a non-technical founder may see only a wall of cryptic alphanumeric strings and jargon. Metrics like pull request counts or lines of code are internal indicators of effort, but they fail to communicate meaningful progress toward broader business objectives. Without a narrative layer, technical velocity appears as a black box, leading to friction when founders cannot reconcile engineering costs with visible product evolution.

Bridging this communication gap requires a shift from reporting numbers to reporting outcomes. Engineering managers must move beyond the “how much” and focus on the “what” by distilling technical activity into functional summaries that describe features, bug fixes, and infrastructure improvements in business terms. Effective reporting contextualizes a week of heavy refactoring not as “technical debt reduction,” but as a strategic investment in system stability that prevents future service interruptions. By translating code changes into plain language, leaders ensure that stakeholders understand the tangible value of the work being performed, rather than just the volume of the output.
Platforms like DevSummary facilitate this transition by automatically analyzing commit logs and generating readable narratives for non-technical audiences. Instead of requiring a manager to manually parse Git history to explain the impact of a sprint, the tool provides a clear account of what was actually shipped and why it matters to the product. This approach helps stakeholders understand What a GitHub commit actually is, in plain English, turning technical milestones into a shared language that everyone in the organization can interpret. The standard for engineering reporting has moved away from raw dashboards toward these automated, narrative-driven insights that demonstrate engineering alignment with the company roadmap.
Local-first reporting protects data privacy without sacrificing insight
Prioritize data privacy as a fundamental constraint for engineering reporting. Granting third-party SaaS platforms read access to private repositories creates significant risks that stall metric adoption. Transmitting source code to external servers increases your attack surface and complicates compliance with data sovereignty laws. To maintain velocity without introducing security friction, shift toward reporting tools that operate within your local environment.
Adopt a local-first desktop application to execute analysis logic on your own hardware instead of the cloud. By using the developer’s existing API keys, the application pulls necessary metadata. This includes commit timestamps, pull request status, and deployment markers, and it functions without ever uploading the actual contents of the source code to a vendor’s database. This approach keeps proprietary logic and sensitive intellectual property behind the corporate firewall. You generate engineering metrics locally, creating high-level summaries while keeping raw data under your direct control.
Implement this localized workflow to satisfy security audits and data-driven management needs simultaneously. This removes the need for the complex procurement cycles typical of cloud-based analysis tools because the data never leaves the workstation. To deploy this model, DevSummary Desktop: local-first engineering reports, source available provides a framework for generating insights without compromising codebase privacy. Keeping the processing local allows your department to provide business transparency while maintaining a zero-trust posture toward technical assets.
Frequently asked questions
What are the big 5 in engineering?
The big five categories for engineering metrics are Discovery, Reliability, Impact, Velocity, and Engagement. This DRIVE framework allows leaders to move beyond simple output tracking by linking technical tasks directly to business outcomes. Monitoring these specific pillars ensures that speed does not compromise system stability or developer well-being during the 2026 fiscal year.
What are the five performance metrics?
The five key performance metrics for delivery are deployment frequency, lead time for changes, change failure rate, failed service recovery time, and reliability. These DORA metrics provide a standardized baseline for measuring the efficiency and stability of the software delivery lifecycle. Tracking reliability specifically ensures that the user experience remains consistent even as deployment velocity increases.
What are some examples of engineering KPIs?
Engineering KPIs include cycle time, sprint burndown, code churn, and mean time to detect (MTTD). These indicators should be selected based on their ability to trigger specific management actions rather than just populating a dashboard. Effective KPIs focus on identifying bottlenecks in the developer experience to reduce friction in the CI/CD pipeline.
What are seven core metrics?
Seven core metrics for engineering health are lead time, cycle time, deployment frequency, change failure rate, MTTR, developer satisfaction, and flow efficiency. Combining these technical and human-centric data points provides a holistic view of team performance. Measuring flow efficiency is particularly useful for identifying wait times where work is stalled between active development stages.
Selecting Your Engineering Metrics Strategy
Before you implement a new measurement framework, you must determine which approach aligns with your current organizational maturity and technical constraints. Answer these five questions to ensure your metrics drive performance rather than friction:
- Audit your strategic objectives; determine whether your organization currently needs to prioritize rapid delivery cycles, long-term architectural stability, or the retention of senior engineering talent.
- Inventory your technical telemetry; verify that your current Git providers, CI/CD pipelines, and project management software can reliably export the specific data points required by your chosen framework.
- Engage your engineering teams; identify which specific bottlenecks currently hinder their daily velocity to ensure the metrics you implement will actually help resolve their real-world friction.
- Review your privacy requirements; establish whether your 2026 security compliance mandates require a local-first reporting architecture to keep sensitive source code metadata within your own infrastructure.
- Define your reporting outputs; select a framework that provides the specific level of abstraction needed to translate raw activity into a coherent narrative for your non-technical executive stakeholders.
Effective engineering metrics must serve the developer first to ensure the data remains high-quality and the team remains motivated. Use Devsummary to automate your reporting and bridge the gap between Git activity and business value at https://devsummary.com/.